

CCR7 is highly expressed in tumor cells and predicts poor prognosis of HCC patients
Our previous study has proved that CC-chemokine receptor like 1 (CCRL1) impairs chemotactic events associated with CCR7 in the progression and metastasis of HCC.24 In order to explore the function of another CC-chemokine CCL21/CCR7 axis in HCC, we investigated the complex microenvironment of HCC by TMA, spatial transcriptomic sequencing and single-cell sequencing (Fig. 1a).

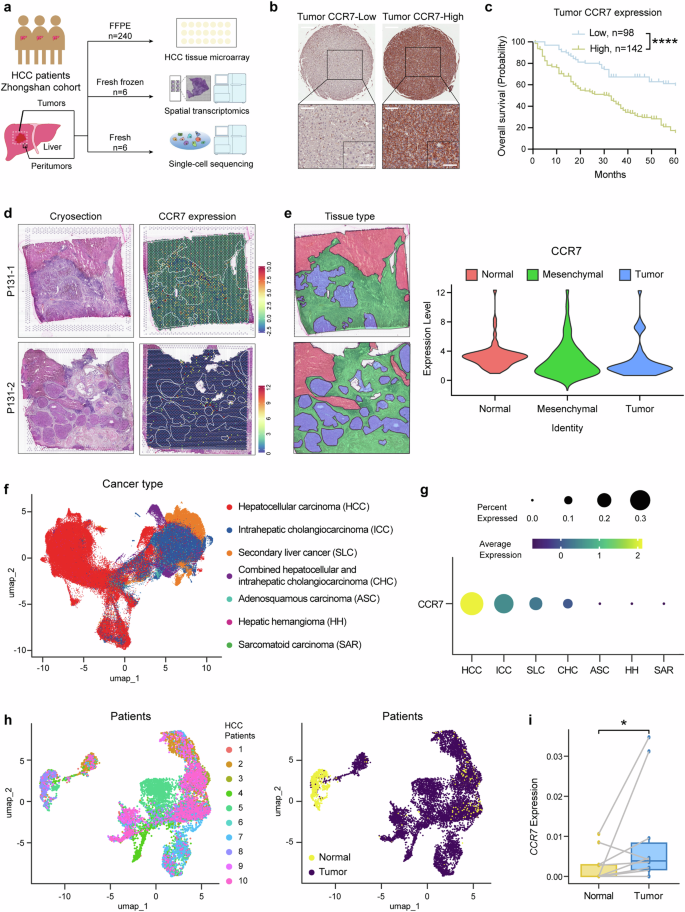
CCR7 is highly expressed in the tumor site. a Schematic overview of experiments in this study. b The representative image of CCR7-Low or CCR7-High expression in HCC TMA by IHC staining. Scale bar (top): 500 μm. Scale bar (bottom-left): 100 μm. Scale bar (bottom-right): 50 μm. c The survival curves of HCC patients with low or high tumor CCR7 expression identified by TMA, n = 240. d Two cryosections were applied for spatial transcriptomics (left). The expression of CCR7 in HCC tissues (right). e The sections were divided into different areas according to the results of dimensionality reduction clustering and pathological diagnosis (left). The distribution of CCR7 in HCC tissues (right). f The uniform manifold approximation and projection (UMAP) plot displaying the distribution of 192,670 epithelial cells across different liver neoplastic diseases. Cells were colored by disease categories. g The mean level of CCR7 gene expression and the percentage of CCR7+ cells determined by scRNA-seq across different liver neoplastic diseases contexts. h UMAP plots showing the identities of 9,315 epithelial cells derived from HCC patients with paired normal and tumor samples. Cells were colored by patient (left) and by tissue type (right). i The average single-cell expression of CCR7 in epithelial cells from paired normal and HCC tumor samples. p value by two-sided log-rank test. *p < 0.05, **p < 0.01, ***p < 0.001, ****p < 0.0001 is considered statistically significant. Data are represented as mean ± SD
Firstly, the CCR7 expression by TMA of HCC patients (n = 240, one of our previous Zhongshan Hospital Cohort13) was identified by IHC. Positive staining of CCR7 protein was primarily observed on the membrane and in the cytoplasm of tumor cells, and based on the staining score of tumor tissue, HCC patients were divided into CCR7-high expression group and CCR7-low expression group (Fig. 1b). The OS of patients revealed a significant difference between the two groups analyzed by the Kaplan–Meier method and the CCR7-high group presented a significantly lower OS compared with the CCR7-low group (Fig. 1c, p < 0.0001). A positive correlation was also found between CCR7 expression and tumor size (p < 0.001), TNM stage (p < 0.001) as well as Age (p = 0.002) (Supplementary Fig. 1a and Supplementary Table 1). Furthermore, it was identified that CCR7 expression served as an independent predictor for OS of HCC patients based on multivariate and univariate analysis (Supplementary Fig. 1b and Supplementary Table 2). To detect CCR7 expression in mesenchymal sites, we observed the samples under different magnifications and were able to clearly identify the mesenchymal sites of the tumor tissues (outlined with dashed lines and separated from the tumor sites, Supplementary Fig. 2a). Representative images showing low (top) and high (bottom) CCR7 expression in mesenchymal sites were presented (Supplementary Fig. 2a). We further analyzed the correlation between the OS of patients and the CCR7 expression in mesenchymal sites of tumor tissues. The results showed that CCR7 expression in mesenchymal sites was not associated with OS of patients (Supplementary Fig. 2b).
Followingly, for further analysis of TME of HCC in detail, 6 tumors and paired adjacent liver tissues from HCC patients (Zhongshan Hospital) were collected for spatial transcriptomic sequencing. CCR7 and CCR7 closely related signals, such as CCL21, CCL19, Pecam1(CD31) and Lyve1, et al., were detected. The representative images of H&E staining (Left) and CCR7 expression of the spatial cluster distribution (Right) from one patient’s tumor tissue were presented (Fig. 1d). Based on pathological diagnosis, the tissues were categorized into 3 regions: normal, mesenchymal and tumor (Fig. 1e, Left). It was shown that CCR7 expression was up-regulated both in the tumor sites and mesenchymal sites (Fig. 1e, Right).
To support these findings, we analyzed a published single-cell RNA-seq dataset from Chinese patients with primary liver cancer.25 The data shown that CCR7 was more widely and highly expressed in HCC epithelial cells, compared with other liver neoplastic diseases, for examples, intrahepatic cholangiocarcinoma (ICC), secondary liver cancer (SLC), combined hepatocellular and intrahepatic cholangiocarcinoma (CHC), adenosquamous carcinoma (ASC), hepatic hemangioma (HH) and sarcomatoid carcinoma (SAR) (Fig. 1f, g). Moreover, CCR7 was significantly higher expressed in epithelial cells of HCC tumor tissues, compared with paired adjacent normal liver tissues of HCC (Fig. 1h, i, p < 0.05, n = 10 patients).
Knockout CCR7 on HCC tumor cells enhances sorafenib sensitivity by inhibiting EMT
It has recently been demonstrated that EMT is one of the chemotherapy resistance mechanisms in urothelial carcinoma (UC), additionally, UC with EMT features was associated with remodeled TME,26 which is consistent with one of our previous studies on cetuximab resistance in colorectal cancer.27 So, we explored whether EMT also participated in the mechanisms of sorafenib resistance in HCC.
Firstly, we investigated the expression of different chemokine receptors in 6 human HCC tumor cell lines (HCCLM3, MHCC97H, Huh7, MHCC97L, SMMC7721, Hep3B) and 1 normal human hepatocyte line (LO2). Interestingly, it was shown that CCR7 expression was obviously different in different cell lines and displayed various levels, compared with CXC-chemokine receptor CXCR4 (Fig. 2a). With CRISPR-cas9 system (Supplementary Fig. 3), HCCLM3 was chosen to establish CCR7 knockout (KO) cell line due to its higher CCR7 expression, whereas Hep3B was chosen to establish CCR7 overexpression (OE) cell line in validation experiments due to its lower CCR7 expression (Fig. 2b, c). It was found that stimulating with CCL21, the invasion of HCCLM3-CCR7-KO decreased, compared with HCCLM3-Control (Fig. 2d, p < 0.001). CCK-8 analysis revealed that the proliferative ability of HCCLM3-CCR7-KO was significantly reduced, compared to HCCLM3-Control (Supplementary Fig. 4, p < 0.01). In addition, sorafenib treatment markedly inhibited the cell growth in the HCCLM3-Control+Sorafenib group, compared to the HCCLM3-Control group (Supplementary Fig. 4, p < 0.001). More importantly, HCCLM3-CCR7-KO+Sorafenib exhibited more sensitivity to sorafenib treatment with the lowest proliferative ability (Supplementary Fig. 4, p < 0.001). With the sorafenib treatment, HCCLM3-CCR7-KO exhibited lower invasion ability compared with HCCLM3-Control (Fig. 2e, p < 0.01). Flow cytometry analysis revealed a higher percentage of apoptotic cells in HCCLM3-CCR7-KO with the sorafenib treatment, compared to HCCLM3-Control (Fig. 2f). Additionally, apoptotic-related markers (cleaved Caspase-9, cleaved Caspase-3 and cleaved PARP) were up-regulated in the HCCLM3-CCR7-KO group treated with sorafenib (Fig. 2g).

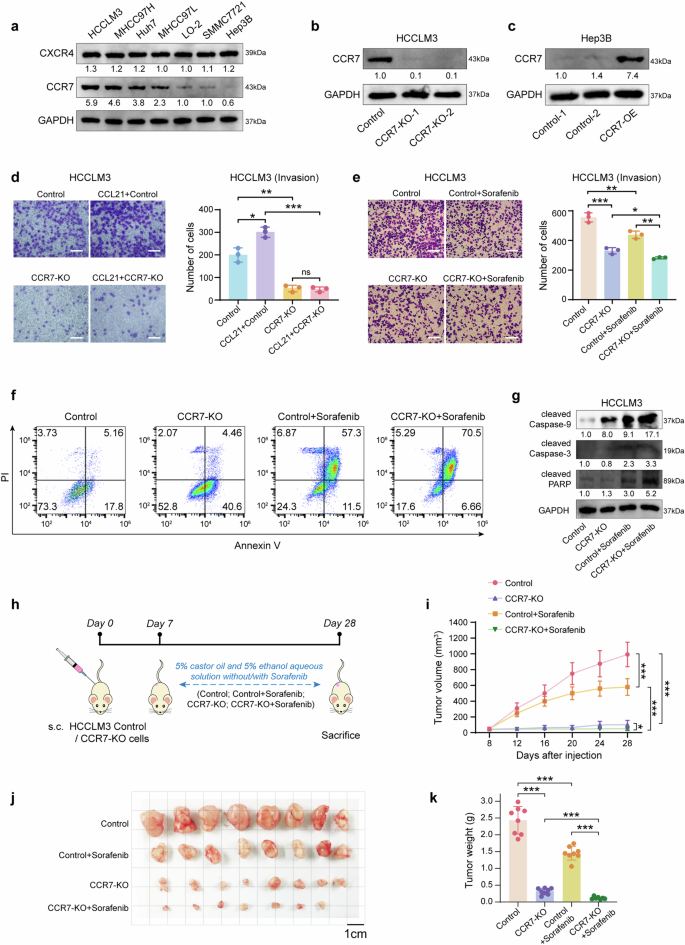
Blocking CCR7 signal enhances the sensibility of sorafenib. a The expression of CCR7 in human HCC cell lines was detected by Western Blot. b, c CCR7 expression after gene knockout (KO) on HCCLM3 (b) and overexpression (OE) on Hep3B (c). d The invasion ability of HCCLM3 was detected by trans-well assay after CCL21 stimulation (left). Quantitative analysis by using Image J (right). e The invasion ability of HCCLM3 was detected after the treatment of sorafenib (left). Quantitative analysis by using Image J (right). f The cell apoptosis was detected by flow cytometry. g The apoptosis-related proteins (cleaved Caspase-9, cleaved Caspase-3 and cleaved PARP) were detected by Western Blot. h The schedule of treatment in mice. i The tumor volume was monitored every four days in all groups. j The image of subcutaneous tumors on HCC mouse models was shown. k The tumor weight was presented. Data in (h–k) were conducted in the same batch, n = 8. ns > 0.05, *p < 0.05, **p < 0.01, ***p < 0.001 by unpaired two-tailed Student’s t test. Data are represented as mean ± SD
Followingly, the subcutaneous tumor mouse models were established (Fig. 2h). It was found that tumors treated with sorafenib in the HCCLM3-CCR7-KO group grew more slowly than the HCCLM3-Control group (Fig. 2i, p < 0.001). Both tumor size and weight of the HCCLM3-CCR7-KO group were decreased compared with the HCCLM3-Control group (Fig. 2j, k, p < 0.001). It is suggested that blocking the CCR7 signal on HCC tumor cells enhances their sensitivity to sorafenib.
The migration ability of HCCLM3 was obviously enhanced with the stimulation of CCL21 for 48 h, whereas there was no significant stimulation effect on the migration ability of Hep3B (Supplementary Fig. 5a), while binding CCR7 with CCR7-specific neutralizing antibody (neu-CCR7) could block the migration and invasion of HCCLM3, respectively (Supplementary Fig. 5b, c). Furthermore, knocking out CCR7 in HCCLM3 by the CRISPR-cas9 system decreased the ability of migration in HCCLM3-CCR7-KO cells (Supplementary Fig. 5d, p < 0.01). At the same time, it was identified that both the invasion and migration abilities of the Hep3B-CCR7-OE group were increased, respectively, compared with Hep3B-CCR7-Control (Supplementary Fig. 5e, f, p < 0.05).
At the same time, we investigated the expression of different EMT-related markers in the seven different cell lines previously mentioned. It was identified that EMT-related markers, such as Vimentin and Twist, were obviously higher expressed whereas E-cadherin were obviously lower expressed in HCCLM3 cells, compared with Hep3B cells (Supplementary Fig. 6). With the CCL21 stimulation, the EMT markers were followingly analyzed in HCCLM3-neu-CCR7 group and HCCLM3-CCR7-KO group, it was identified that EMT-related markers were reversed in both groups, compared with HCCLM3-Control (Supplementary Fig. 7a, c), whereas there was no obvious change in Hep3B groups (Supplementary Fig. 7b). As expected, Overexpression CCR7 of Hep3B cells increased EMT-related markers, and it was identified that N-cadherin, β-catenin, Twist and Snail were up-regulated in the group of CCL21-CCR7-OE (Supplementary Fig. 7d). Meanwhile, comparing to HCCLM3-Control+Sorafenib, HCCLM3-CCR7-KO+Sorafenib down-regulated the expression of N-cadherin, Twist and Snail, whereas up-regulated the expression of E-cadherin, resulting in the lower EMT ability. (Supplementary Fig. 7e).
Finally, the downstream pathways of CCR7-mediated EMT were subsequently analyzed and determined that both p-AKT and p-ERK were significantly increased by CCL21 stimulation in HCCLM3 cells, which was reversed by neu-CCR7 and CCR7-Knockout, as shown in CCL21-neu-CCR7 group and CCL21-CCR7-KO group (Supplementary Fig. 8a, c). Meanwhile, there was no obvious change in Hep3B cells treated with CCL21 and neu-CCR7 (Supplementary Fig. 8b), whereas over expression of CCR7 in Hep3B enhanced the p-AKT and p-ERK in the CCL21-CCR7-OE group (Supplementary Fig. 8d). Meanwhile, HCCLM3-CCR7-KO+Sorafenib exhibited lower p-AKT expression than HCCLM3-Control+Sorafenib. (Supplementary Fig. 8e).
High infiltration of CCR7+ immune cells in HCC tumor mesenchyme with higher expression of CCL21, CCL19 and Pecam1(CD31)
Although high expression of CCR7 in tumor cells is related to EMT and sorafenib resistance, however, a higher CCR7 expression was also found in mesenchymal sites in HCC (Fig. 1e), which was often involved in the infiltration of CCR7+ immune cells. Therefore, in order to identify the complicated TME of HCC, we analyzed the expression of CCR7-related ligands based on the previous spatial transcriptomics analysis on the HCC patient dataset.28 The representative images of CCL21, CCL19 and Pecam1(CD31) as well as Lyve1 from Patient 1 and Patient 2 were presented (Fig. 3a–d). Compared with the peritumor area, CCL21 (Fig. 3e), CCL19 (Fig. 3f) and Pecam1(Fig. 3g) were more highly expressed in the tumor area, whereas Lyve1 had lower expression (Fig. 3h). To explore the complicated TME of HCC in detail, we collected fresh tumor tissues from Zhongshan Hospital and used single-cell sequencing to identify endothelial cells, epithelial cells, fibroblasts, cycling cells and immune cells. It was confirmed that endothelial cells, epithelial cells and fibroblasts showed lesser expression of CCR7, whereas CCR7 was predominantly expressed in immune cells, such as CD4+ T cells, naïve B cells, DCs and macrophages (MΦs) (Fig. 3i), especially naïve CD4+ T cells were the predominant population (Fig. 3j). Notably, CCR7 expression in CD4+ T cells and B cells was varied individually in the peritumor and tumor tissues (Fig. 3k, l).

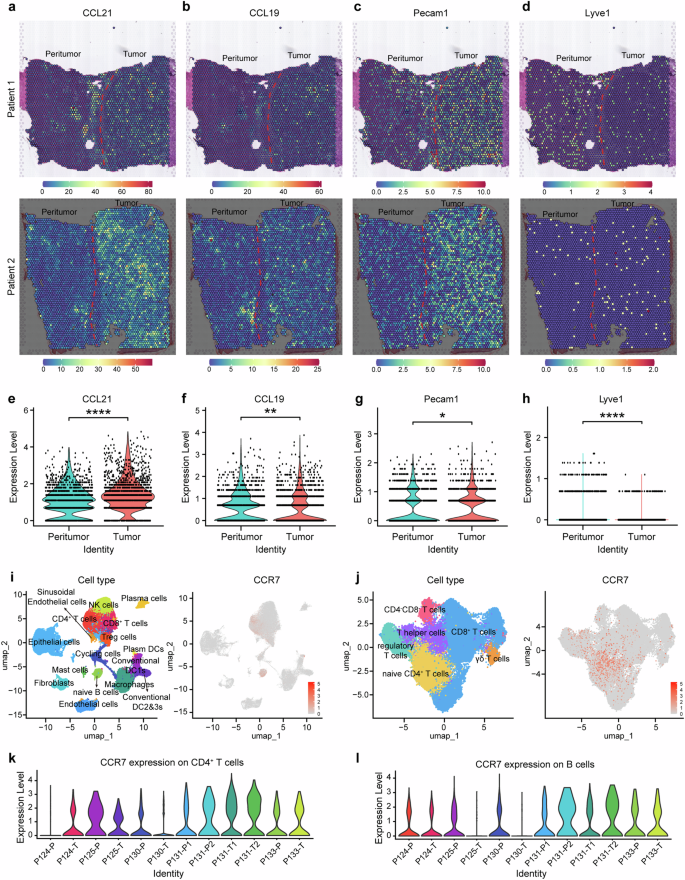
Spatial transcriptomics and single-cell sequencing reveal infiltration of CCR7+ immune cells in tumor. a–h The distribution of CCL21 (a), CCL19 (b), Pecam1 (c) and Lyve1 (d) in HCC tissues by spatial sequencing. Quantitative analysis of CCL21 (e), CCL19 (f), Pecam1 (g) and Lyve1 (h). i Single-cell sequencing was sorted from 6 tumors of HCC patients. UMAP visualization of single-cell sequencing data of non-tumor cells (left). CCR7 expression within non-tumor cells (right). j UMAP visualization of single-cell sequencing data of T cells (left). CCR7 expression within T cells (right). k, l CCR7 expression in CD4+ T cells (k) and B cells (l) between the tumor (-T) and corresponding peritumor tissues (-P). *p < 0.05, **p < 0.01, ***p < 0.001, ****p < 0.0001 by unpaired two-tailed Student’s t test. Data are represented as mean ± SD
VEGF-C is positively related to CCR7 expression in mesenchymal sites and identified as an independent predictor for OS of HCC patients
As lower expression of Lyve1 in tumor sites was identified by spatial transcriptomics analysis in this study (Fig. 3h) and lymphatic angiogenesis was often driven by VEGF-families, we subsequently explored the correlation of VEGF-families with CCL21, CCL19, Pecam1 (CD31) and Lyve1 by the TCGA database of HCC. The data revealed that VEGF-C was significantly positively correlated with CCL21, CCL19 and Lyve1 (Supplementary Fig. 9a–c), whereas VEGF-D (Supplementary Fig. 9d-f) and VEGF-A (Supplementary Fig. 9g–i) had no obvious positive correlations with the CCR7 related ligands, suggesting the close correlation between CCR7+ infiltrated cells and VEGF-C.
Therefore, VEGF-C expression was further identified by TMA of HCC patients (n = 382, Zhongshan Hospital, Fig. 4a). The representative images of VEGF-C expression in tumor and peritumor were shown in Fig. 4b. The quantitative analysis data from tissue sections of 382 patients revealed that the intensity of VEGF-C expression in peritumor sites was higher than in tumor sites (Fig. 4c). Based on the different levels of VEGF-C expression in peritumor sites, all of 382 patients were divided into VEGF-C-High and VEGF-C-Low group. The representative images were shown in Fig. 4d. It was also found that the VEGF-C-High group was significantly correlated with high expression of CCR7 in mesenchymal sites, which was involved in the infiltration of CCR7+ immune cells (Fig. 4e, n = 382, p = 0.001). As a result, it was revealed that the OS of the VEGF-C-High group with high expression of CCR7 was significantly higher than the VEGF-C-Low group with low CCR7 expression (Fig. 4f, p = 0.0413), whereas there was no significant difference between other groups (data not shown). Meanwhile, VEGF-C expression in the peritumor was also associated with tumor TNM stage (Fig. 4g and Supplementary Table 3, p = 0.016). Univariate and multivariate analysis showed that VEGF-C was an independent predictor for the OS of patients with HCC (Fig. 4h, i and Supplementary Tables 4, 5).

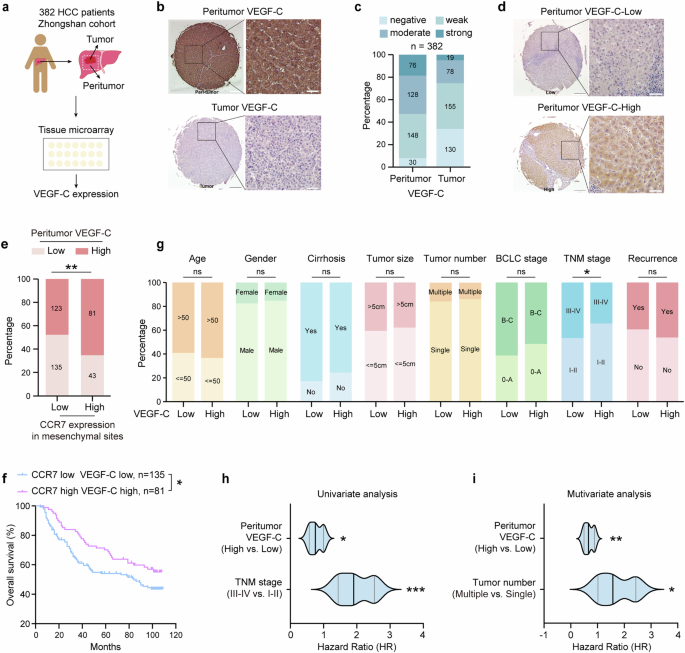
VEGF-C is positively related with CCR7 expression in mesenchymal sites and identified as an independent predictor for OS of HCC patients. a Schematic overview of HCC TMA collection and analysis (n = 382). b The representative images of VEGF-C expression in peritumor and tumor sites in TMA. Scale bar (left):500μm. Scale bar (right):50μm. c The intensity distribution of VEGF-C expression in peritumor and tumor sites from HCC TMA. d The representative image of VEGF-C-Low or VEGF-C-High expression in peritumor sites from HCC TMA (n = 382). Scale bar (left):500μm. Scale bar (right):50μm. e The correlation between VEGF-C and CCR7 expression in the mesenchymal sites in HCC TMA. f Kaplan–Meier analyses of OS based on CCR7 in mesenchymal sites and VEGF-C in peritumor sites from HCC TMA. g Correlations between VEGF-C expression in peritumor sites and clinical characteristics of patients with HCC from TMA. h Univariate analysis of factors associated with OS of HCC patients from TMA. i Multivariate analysis of factors associated with OS of HCC patients from TMA. Data in (a–i) were conducted in the same batch, n = 382. p value by two-sided log-rank test. ns > 0.05, *p < 0.05, **p < 0.01, ***p < 0.001 were considered statistically significant
VEGF-C promotes the TLSs formation by lymphatic angiogenesis and activating CCL21/CCR7 axis
To explore the detailed role of VEGF-C on HCC in vivo, the orthotopic HCC mouse models were established with or without VEGF-C treatment (Fig. 5a). In the VEGF-C group, the mice were treated with systemic VEGF-C administration, and the concentration of VEGF-C in the serum significantly increased after administration (Supplementary Fig. 10a). In order to explore the effect of VEGF-C on tumor growth in the orthotopic HCC mouse model, the ratio of the tumor-bearing liver weight to body weight in mice was analyzed. It showed no significant difference between the Control group and the VEGF-C group, indicating that VEGF-C treatment had no effect on tumor growth in these models (Supplementary Fig. 10b, c). The tumor tissues were collected to perform transcriptome sequencing. With the help of Principal Component Analysis (PCA) and heatmap statistical visualization, it was identified that VEGF-C treatment obviously changed the transcriptome sequencing of tumor tissues, compared with Control group (Fig. 5b, c). Among the differentially expressed genes between the two groups, it was found that the lymphatic endothelial marker Lyve1 was significantly upregulated in the volcano plots of VEGF-C group vs Control group (Fig. 5d), while the vascular endothelial marker Pecam1 showed no significant change between the two groups (Fig. 5e). CD31(Pecam1) and LYVE1(Lyve1) expression in tumor tissues of the orthotopic HCC mouse models were also identified by IHC analysis, which was shown by the representative images (Fig. 5f). It was confirmed by quantitative analysis with Image J that comparing with control group, the exogenous VEGF-C treatment significantly promoted the lymphatic angiogenesis within the HCC tumor sites (Fig. 5g, p < 0.01). Unexpectedly, TLSs were found in the tumor sites of the VEGF-C treatment group (Fig. 5h), which were further confirmed by multiplex immunofluorescence assay, indicating the presence of CD20+ B cells, CD3+ T cells and CD21+ follicular DCs, which were organized into lymphoid structures (Fig. 5i). VEGF-C treatment significantly increased the TLS ratio to tumor area by quantitative analysis (Fig. 5j).

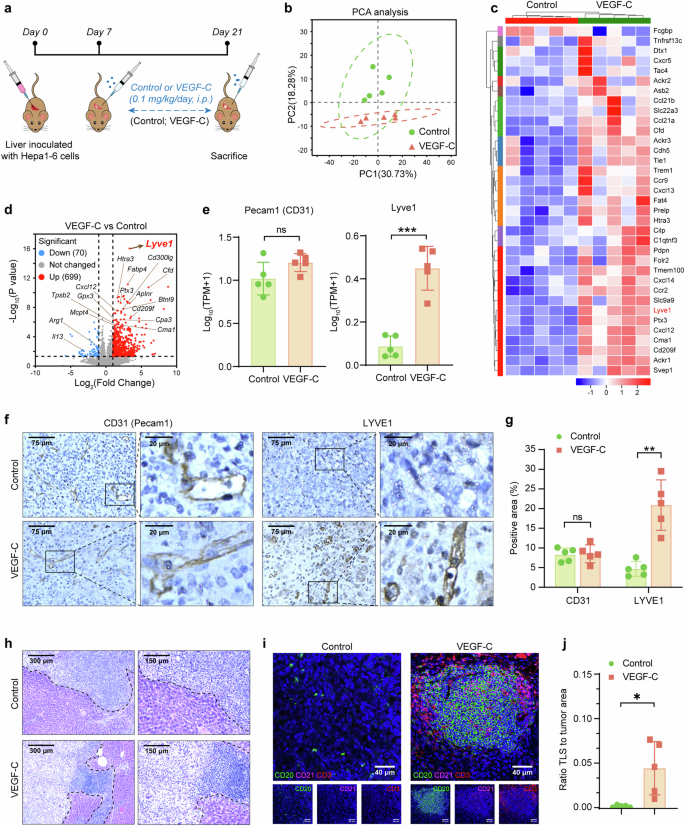
CCL21/CCR7 signal is activated by VEGF-C administration, which promotes the TLSs formation by lymphatic angiogenesis. a The schedule of treatments in the orthotopic HCC mouse model. b The PCA analysis of transcriptome sequencing of tumor tissues from the orthotopic HCC mouse model. c, d The heatmap (c) and volcano plots (d) of differential expression genes from transcriptome sequencing. e The expression of Pecam1 (left) and Lyve1 (right) genes in tumor from transcriptome sequencing. f The representative images of CD31 and LYVE1 in tumor by IHC staining. g Quantitative analysis of (f) by using Image J. h The tumor and peritumor samples from orthotopic HCC mouse tumors were observed by H&E staining. i Multiplex immunofluorescence assay of TLSs was performed in the orthotopic HCC mouse model. j The ratio of tumor area occupied by TLSs was quantitatively analyzed using Image J. Data in (a–j) were conducted in the same batch, n = 5. ns > 0.05, *p < 0.05, **p < 0.01, ***p < 0.001 by unpaired two-tailed Student’s t test. Data are represented as mean ± SD
Followingly, the differentially expressed genes by transcriptome sequencing were analyzed with GO enrichment. It was found that there was a significant enrichment in the regulation of chemotaxis pathway in the VEGF-C treatment group (Supplementary Fig. 11a). CCL21 (Ccl21a and Ccl21b), the ligand of CCR7, rather than CCL19, was significantly upregulated in the VEGF-C treatment group (Supplementary Fig. 11b, c). Although there was no obvious change of CCR7 expression in the VEGF-C treatment group (Supplementary Fig. 11d), it was identified by IHC that not only CCL21 expression, but also the infiltration of CCR7+ cells into mesenchymal sites was significantly increased in the VEGF-C treatment group (Supplementary Fig. 11e–g).
To explore the related biological mechanisms, the effect of VEGF-C on mouse lymphatic endothelial cells (mLECs) was tested in vitro. It was identified that VEGF-C improved the tube formation of mLECs (Supplementary Fig. 12a, b). In addition, it was also identified by ELISA the CCL21 concentration in the supernatant of mLECs culture was significantly increased with VEGF-C treatment (Supplementary Fig. 12c, 56.08 ± 5.32 pg/ml vs 51.98 ± 5.47 pg/ml, p < 0.05). As a result, the improved migration ability of CCR7+macrophage (RAW264.7) was identified by co-culture with the supernatant of mLECs treated with VEGF-C (Supplementary Fig. 12d, e).
To investigate the relationships among VEGF-C, CCL21, LYVE1, and CCR7 in clinical HCC patients, we analyzed the spatial distribution of them based on the previous spatial transcriptomics dataset from HCC patients.28 The Pearson analysis was used to assess the correlation among VEGF-C, CCL21, LYVE1, and CCR7. The analysis revealed co-localization and strong positive correlations between the expressions of VEGF-C and CCL21 (Supplementary Fig. 13a, b), VEGF-C and LYVE1 (Supplementary Fig. 13c, d), VEGF-C and CCR7 (Supplementary Fig. 13e, f), as well as CCL21 and CCR7 (Supplementary Fig. 13g, h). These findings suggested that VEGF-C induced lymphatic angiogenesis in HCC tumors (VEGF-C vs. LYVE1), then CCR7+ cells were introduced into the tumor through lymphatic vessels under the chemotactic influence of CCL21 (VEGF-C vs. CCL21, VEGF-C vs. CCR7, and CCL21 vs. CCR7). Furthermore, we performed double immunostaining on the tumor tissues from orthotopic HCC mouse models. The experimental results revealed the presence of CCR7+ cells within lymphatic vessels induced by VEGF-C, which indicated that CCR7+ cells migrated into the tumor through the lymphatic vessels (Supplementary Fig. 14).
Additionally, based on the previous dataset of transcriptome sequencing on the mice tumor tissues in this study, it was also revealed that a group of genes associated with tumor immunology, such as Cd209 families (CD209a, CD209d, CD209f), CD36, CD300lg, et al. were upregulated in the VEGF-C treatment group (Supplementary Fig. 15a). Especially, with GSEA (Gene Set Enrichment Analysis) sorting, it was revealed that VEGF-C upregulated several signal pathways, such as the SIGNALING BY THE B_CELL_ RECEPTOR_BCR (Supplementary Fig. 15b) and INITIAL_TRIGGERING_OF_COMPLEMENT (Supplementary Fig. 15c), et al. The increased infiltration of immune cells (CD11b+, CD68+, MHC II+, CD3+) into the tumor sites in the VEGF-C treatment group was demonstrated by IHC staining (Supplementary Fig. 15d, e).
VEGF-C increases the efficacy of anti-PD-1 immunotherapy for HCC
Immunotherapy, particularly anti-PD-1, has been widely used in the clinical treatment of HCC, but the response rate was limited.3 Whereas TLSs in tumor tissues have been recently proven to promote immunotherapy response in previous studies,11,29 therefore we proposed the hypothesis that VEGF-C might increase the response of anti-PD-1 immunotherapy. The orthotopic HCC mouse models were established with Hepa1-6 cells carrying the luciferase reporter gene (Hepa1-6-luc-GFP), and based on the treatments, the animals were divided into 4 groups: Isotype, Isotype + VEGF-C, Anti-PD-1, Anti-PD-1 + VEGF-C (Fig. 6a). The concentration of VEGF-C was significantly increased in the serum of mice after VEGF-C administration (in Isotype + VEGF-C group and Anti-PD-1 + VEGF-C group, as shown in Supplementary Fig. 16). The luciferase signals were reported with In Vivo Imaging System, which were presented by the representative images (Fig. 6b). Based on the quantitative analysis of luciferase signals, it was revealed that the fluorescence intensity of Anti-PD-1 + VEGF-C group was weaker on Day 14 than the Anti-PD-1 group, suggesting the combination of VEGF-C enhanced the efficacy of Anti-PD-1 immunotherapy (Fig. 6c). It was followingly identified by IHC analysis that VEGF-C treatment promoted the lymph angiogenesis in tumor (Fig. 6d, e), whereas there was no obvious effect on the angiogenesis (Supplementary Fig. 17).

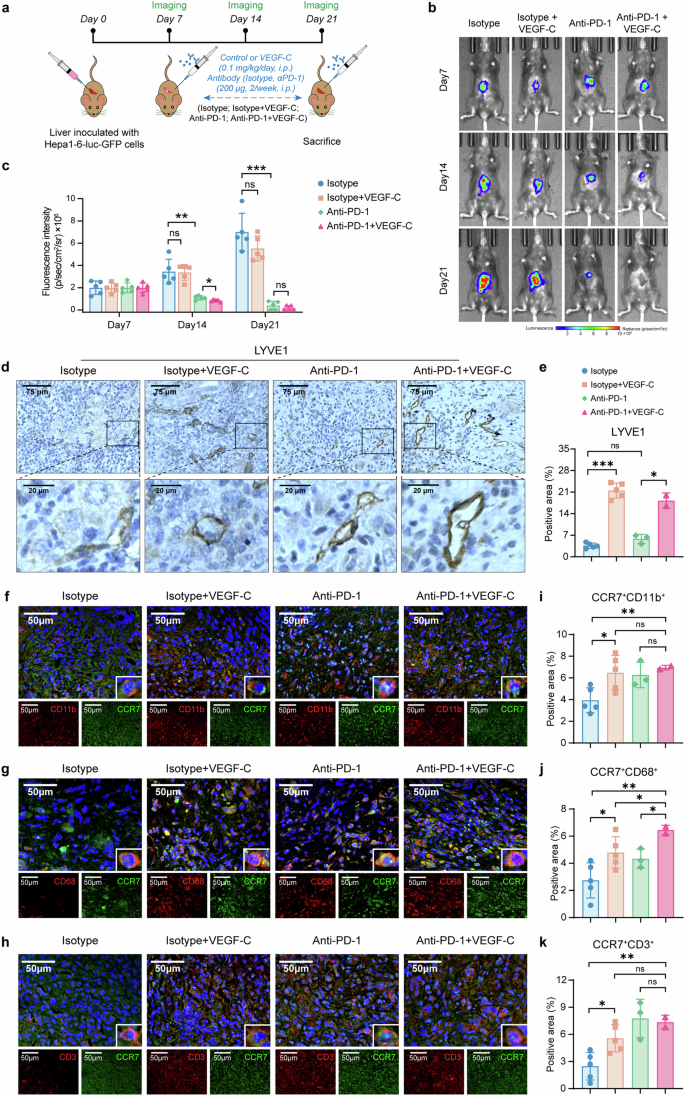
VEGF-C increases the efficacy of Anti-PD-1 immunotherapy for HCC. a The schedule of imaging and treatments. b The representative images of luciferase signal in vivo. c The luciferase signal was monitored by in vivo imaging system once a week. n = 5. d The representative images of LYVE1 in tumor by immunohistochemical staining. e Quantitative analysis of (d) by Image J. f–k The representative images of CCR7+CD11b+ cells (f), CCR7+CD68+ cells (g), CCR7+CD3+ cells (h) in tumor by immunofluorescence staining. Quantitative analysis of CCR7+CD11b+ cells (i), CCR7+CD68+ cells (j), CCR7+CD3+ cells (k) by Image J. Data in (a–k) were conducted in the same batch, n = 5. ns > 0.05, *p < 0.05, ***p < 0.001 by unpaired two-tailed Student’s t test. Data are represented as mean ± SD
Besides, the infiltration of CCR7+ immune cells into the tumor sites through lymphatic vessels were also identified by immunofluorescent staining, such as CCR7+CD11b+, CCR7+CD68+and CCR7+CD3+ cells (Fig. 6f-h). The quantitative analysis data showed that compared with Isotype, Isotype + VEGF-C could increase the infiltration of CCR7+CD11b+ cells, CCR7+CD68+ cells and CCR7+CD3+ cells (Fig. 6i–k, p < 0.05), while Anti-PD-1 + VEGF-C increased more infiltrated CCR7+ cells (Fig. 6i-k, p < 0.01). These findings indicated that VEGF-C treatment increased the infiltration of CCR7+ immune cells, which contributed to the enhanced efficacy of anti-PD-1 immunotherapy and resulted in the inhibition of tumor progression.
Additionally, we analyzed the relationships among TLSs, CCR7, VEGF-C in tumor tissues from clinical HCC patients treated with Anti-PD-1 immunotherapy based on publicly available datasets.30,31 These studies divided HCC patients into Non-responders and Responders to immunotherapy, and representative HE-stained images were shown in Supplementary Fig. 18a.30 Using spatial transcriptomics and bulk transcriptome sequencing, we examined the spatial distribution of TLSs and the related gene expressions marked by a published TLS-related gene signature,32 as well as the distribution and expressions of CCR7 and VEGF-C in tumor tissues (Supplementary Fig. 18b–d). The results revealed that TLSs were more frequently observed in tumors in Responders group, and the expressions of TLS-related genes were significantly higher compared to the Non-responders group (Supplementary Fig. 18e). Meanwhile, the expression level of CCR7 × VEGF-C (a combined measure of CCR7 and VEGF-C expressions) was higher in the tumor tissues from the Responders group (Supplementary Fig. 18f). Further analysis demonstrated a significant positive correlation between the expressions of TLS-related genes and CCR7 × VEGF-C (Supplementary Fig. 18g). These findings indicated the closely related relationships among TLSs, CCR7, VEGF-C in HCC tumor tissues. Moreover, the presence of TLSs and the elevated expressions of CCR7 and VEGF-C in tumor tissues can serve as indicators of a favorable response to anti-PD-1 immunotherapy in HCC patients.