


Identification of dysregulated expressed genes
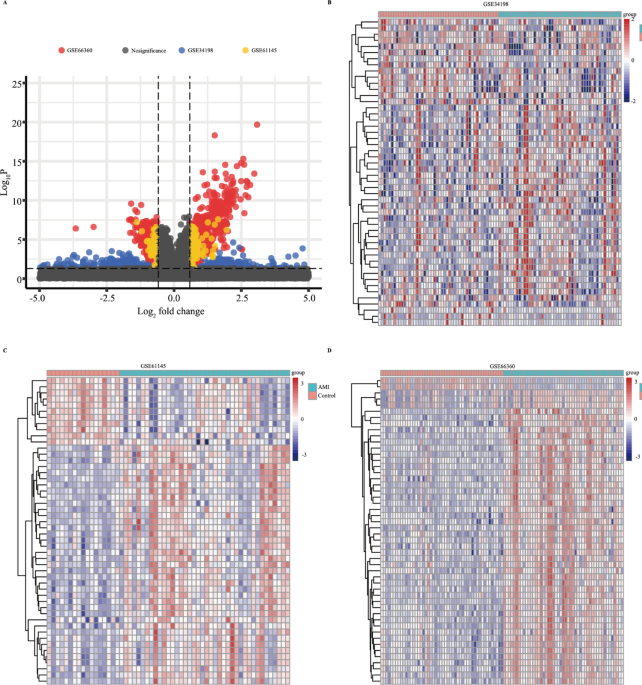
As the work flow shown in Fig. S1, three GEO data sets (GSE61145, GSE34198, and GSE66360) were included in this study. A total of 697, 163, and 734 up-regulated and 679, 72, and 741 downregulated genes were obtained in GSE34198, GSE61145, and GSE66360 respectively (Fig. 1A). According to the heatmap shown in Fig. 1B–D, the expression of top 50 differential genes in GSE34198, GSE61145, and GSE66360 datasets between healthy control and AMI groups showed a differential distribution. To identify the DEGs, the dysregulated expressed genes of GSE34198, GSE61145, and GSE66360 were overlapped, and 134 differentially upregulated and 25 differentially downregulated genes (Fig. 2A,B and Table S2) were obtained.

The dysregulated expressed genes in Gene Expression Omnibus (GEO) datasets. (A) Volcano plot of significant dysregulated expressed genes between AMI and healthy control samples. (B–D) Heatmap of the top 50 significantly upregulated or downregulated genes in GSE34198 (B), GSE61145 (C), and GSE66360 (D).

The differential expressed genes and function enrichment analysis. (A, B) 134 differentially upregulated genes (A) and 25 differentially downregulated genes (B) overlapped by GSE34198, GSE61145, and GSE66360. (C–E) The top 10 enrichment score values for significantly enriched Gene Ontology (GO) terms including biological process (C), cellular component (D), and molecular function (E). (F) Kyoto encyclopedia of genes and genomes (KEGG) analysis of differential expressed genes (DEGs)20,21,22.
Function enrichment analysis
To identify biological function of the DEGs, GO enrichment and KEGG pathway enrichment analysis were conducted. Significantly enriched biological functions are summarized in Table S3. Within the biological process category, positive regulation of cytokine production, positive regulation of cell activation, cytokine-mediated signaling pathway, T cell activation, myeloid leukocyte activation, and acute inflammatory response were significantly annotated (Fig. 2C). Within the cellular component category, secretory granule lumen, cytoplasmic vesicle, vesicle lumen, and tertiary granule lumen were significantly annotated (Fig. 2D). Within the molecular function category, pathways involved in immune receptor activity, cytokine receptor activity, NAD+ nucleosidase activity, and MHC class I receptor activity were significantly annotated (Fig. 2E). KEGG analysis indicated that the tumor necrosis factor signaling pathway, neutrophil extracellular rap formation, interleukin (IL)-17 signaling pathway, programmed cell death ligand 1 and programmed death cell protein 1 checkpoint pathway, nuclear factor kappa beta signaling pathway, and Toll-like receptor signaling pathway were significantly enriched (Fig. 2F). These results revealed that the DEGs were involved in immune regulation during the occurrence and progression of AMI.
Identification of hub genes by WGCNA
Based on the expression of GEO data sets, WGCNA was performed to screen the key module and genes that mostly correlated with the AMI. To establish a scale-free network, the scale-free index and mean connectivity were calculated (Fig. 3A,B). Then, a soft threshold of 10 was implemented. MEyellowgreen module showed the strongest correlation with AMI features (r = -0.36; Fig. 3C,D). Scatter diagrams were constructed for correlation analysis between gene significance for AMI and module membership in the yellowgreen module, which revealed that genes were significantly corelated with AMI (corelation = -0.5, p = 0.0036; Fig. 3E).

Identification of the hub genes by weighted gene co-expression network analysis (WGCNA) analysis. (A) Scale-free index for soft-threshold power (β) in AMI. (B) Mean connectivity analysis for various soft-threshold powers. (C) mRNA clustering dendrogram obtained by hierarchical clustering of topological overlap matrix (TOM)-based dissimilarity. (D) Heatmap of the correlation between module eigengene between AMI and healthy controls. (E) Correlation analysis between gene significance of AMI and module membership in the yellowgreen module.
Identification of hub genes by machine learning
To further reveal the hub genes, the 159 DEGs were screened by SVM in GSE34198. Results indicated that 39 hub genes were identified with an accuracy of 0.753 (Fig. 4A and Table S2, S4). These DEGs were further screened by RF; after determining mtry and ntree parameters, 30 stable genes were retained by RF analysis, which were ranked as important factors in the division of AMI (Fig. 4B,C and Table S2). LASSO analysis identified that 14 hub genes were clarified (Fig. 4D,E and Table S2). The hub genes screened by SVM, RF, LASSO and WGCNA were further overlapped, and 19 hub genes were obtained (Fig. 5A). The stepwise regression method was used to further reduce the gene set, and finally 10 hub genes, including VNN3, FOS, IL18RAP, DUSP1, RHOU, KLHL6, DUSP2, PLA2G7, SLPI, and TCN1 were identified.

Identification of the hub genes by machine learning. (A) support vector machine (SVM) analysis. (B, C) The index (B) and number (C) grown for random forest (RF) analysis; (D, E) Cross-validation to select the optimal tuning parameter log (Lambda) (D) and least absolute shrinkage and selection operator (LASSO) coefficient profiles (E) by LASSO regression analysis.

Development and validation of the diagnostic model. (A) The intersection of candicated genes using the weighted gene co-expression network analysis (WGCNA), support vector machine (SVM), random forest (RF) and least absolute shrinkage and selection operator (LASSO) analysis. (B) The clinical diagnostic model in GSE34198. (C) The clinical diagnostic model in GSE66360.
Development and validation of diagnostic model
DUSP1, VNN3, and FOS showed a positive relationship, while RHOU displayed a negative relationship with DUSP1, VNN3, and FOS (Fig. S2). Expression analysis indicated that the 10 hub genes were dysregulated in GSE34198, GSE66360 and GSE66360 (Fig. S3A–C). However, only four hub genes, including VNN3, FOS, IL18RAP, and DUSP1, were identified in GSE61145. Therefore, GSE34198 and GSE66360 were selected to develop and validate the diagnostic model. We first assessed the diagnostic values of the 10 hub genes in GSE34198 and GSE66360 by ROC curves. The diagnostic values of VNN3, FOS, IL18RAP, DUSP1, RHOU, KLHL6, DUSP2, PLA2G7, SLPI, and TCN1 in GSE34198 and GSE66360 were 0.767 vs. 0.76, 0.766 vs. 0.833, 0.713 vs. 0.489, 0.676 vs. 0.77, 0.647 vs. 0.648, 0.651 vs. 0.702, 0.655 vs. 0.73, 0.59 vs. 0.769, 0.617 vs. 0.71, and 0.566 vs. 0.697, respectively (Fig. 5B,C). Nevertheless, We found that the combine model of 10 hub genes was 0.932 vs. 0.953. These results indicated that this combined model can act as a diagnostic marker to predict AMI and may indicate the involvement of immune cell infiltration during AMI development.
Immune cell infiltration and correlation analysis
To explore the role of immune cells in AMI, principal component analysis (PCA) was conducted according to the expression profile of the 10 hub genes, which efficiently distinguished AMI and healthy control samples (Fig. S4A and Table S5). CIBERSORT method was applied to analyze the infiltration of 22 types of immune cells in clinical samples. The correlation analysis revealed negative regulation among immune cells, such as between resting NK cells and gamma delta T cells, naïve CD4 T cells and M0 macrophages, naive CD4 T cells and neutrophils, activated CD4 memory T cells and Tregs, and neutrophils and CD8 T cells (Fig. S4B). The AMI group showed a higher fraction of naive B cells and activated CD4 memory T cells and a lower fraction of resting mast cells than did the healthy control group (p < 0.05; Fig. S4C).
The expressions of VNN3, FOS, IL18RAP, and DUSP1 were positively correlated with activated CD4 memory T cells, M0 macrophages, and neutrophils and negatively correlated with CD8 T cells, naive CD4 T cells, Tregs, monocytes, and resting mast cells. RHOU in Tregs, KLHL6 in plasma cells, monocytes, and resting mast cells, DUSP2 in CD8 T cells, PLA2G7 in monocytes and resting mast cells, SLPI in neutrophils, and TCN1 in resting CD4 memory T cells, M0 macrophages, and neutrophils were positively correlated. However, RHOU in plasma cells, resting NK cells, and M0 macrophages, DUSP2 in naïve CD4 T cells and neutrophils, and TCN1 in CD4 naive T cells and resting dendritic cells were negatively correlated (p < 0.05; Fig. 6A). As shown in Fig. 6B, HE staining showed that myocardial infarction tissue showed massive congestion and edema with tissue necrosis, which indicated an acute myocardial infarction model were successfully established. Immunohistochemical staining of continuous tissue sections were used to detect the protein expression of hub genes (FOS and IL18RAP), and immune cells. The levels of FOS, IL18RAP, CD4 naive T (CD4), and neutrophils (LY6G) were significantly upregulated in AMI (Fig. 6C). Together, these results suggest that the 10 hub genes that regulate immune cell infiltration may be potential diagnostic biomarkers for AMI.

Immune cell infiltration in AMI. (A) Heatmap of correlations between the 10 hub genes and infiltrated immune cells. Immunohistochemical staining. (B) Hematoxylin-eosin staining of control and AMI in vivo. (C) The expression of c-FOS, IL18RAP, CD4 and LY6G by immunohistochemistry. *** means p < 0.001.


Leave feedback about this