


Participants and study design
The data was from a follow-up study of college students at Binzhou Medical University in Yantai, Shandong Province20,21. The first wave of data was collected between August 23 and September 23, 2019. Baseline information including questionnaires and blood samples22. The questionnaire contained the following:
-
Demographic data (age, sex, BMI).
-
Lifestyle information (smoking, drinking).
-
Frequency of food consumption (fish consumption).
-
Mental health information (depressive symptoms).
The follow-up information collection was conducted when they were set to leave school for internships. The follow-up was conducted from May 25, 2021 to May 28, 2021 for nursing majors, and from December 19, 2021 to December 21, 2021 for clinical medicine majors. The collection of follow-up data comprised a self-reported questionnaire and blood samples. Inclusion criteria: high school and residence locations in Shandong Province; age of 18 or older; admission to Binzhou Medical University was in 2019. Exclusion Criteria: have chronic medical conditions; surgery within the past month; have hearing or speech impairments. There were 857 participants recruited at baseline and 477 at follow-up, with 380 participants lost to follow-up. Finally, we included 477 subjects with total results of blood mercury and questionnaire data from both 2019 and 2021 in the analyses. Fig. 1 shows the distribution map of the study subjects. This study was reviewed and approved by the Ethics Committee of Binzhou Medical University, and all study subjects signed the informed consent form (NO.2019075).

Distribution map of study subjects. The picture is the map of Shandong Province; The yellow dots represent participants’ home addresses.
Collection and measurement of mercury
Venous blood samples were collected by an experienced nurse using a tube containing EDTA. Whole blood samples and centrifuged upper serum layers were stored at -80 °C until analysis. The quantitative analysis was conducted using inductively coupled plasma mass spectrometry (ICP-MS) at the Central Lab of Biological Elements in Peking University Health Science Center with the analytical protocol certified by China metrology accreditation (CMA). The 0.35 mL blood sample was transferred into a quartz tube, followed by the addition of 0.40 mL nitric acid. The quartz tube was pre-digested at room temperature for two hours and then placed in an Ultra WAVE microwave digestion system (Ultra WAVE, Milestone, Italy) for 50 min. Subsequently, 0.10 mL of indium internal standard (2 ng/mL) was added to the sample, which was then diluted to a final volume of 8 mL with ultra-pure water. Finally, the heavy metal content in the whole blood was determined using ICP-MS. The methodological details of laboratory analysis have been described in previous studies22. The total mercury concentration of the whole blood was reported in nanograms per milliliter (ng/mL). Quality assurance and quality control (QA/QC) measures are as follows: Reagent blanks and procedural blanks were prepared along with each analysis batch to eliminate potential background contamination. The limit of detection (LOD) for mercury was calculated as three times the standard deviation (SD) of the replicate measurements (11 times) of the procedural blank samples. The LOD of mercury was 0.002 ng/mL. The concentration of mercury used standard blood samples (Clinchek®– Whole Blood Control:8841) for quality control and its values (mean ± standard deviation) were 5.63 ± 0.12 ng/mL (n = 6), which was consistent with the certified values range 5.57 (4.18, 6.96) ng/mL. Besides, to investigate the antagonistic effect of selenium on mercury, selenium concentrations were measured simultaneously with mercury concentrations using the same analytical method, achieving a LOD of 0.05 ng/mL.
Measurement of depressive symptoms
The 9-item Patient Health Questionnaire (PHQ-9) was used to assess participants’ depressive symptoms. Each of the nine items in the questionnaire is rated on a scale from 0 (not at all) to 3 (almost every day), for a total score of 0–2723. Based on the diagnostic criteria for depression in the Diagnostic and Statistical Manual of Mental Disorders-IV (DSM-IV), the PHQ-9 is widely used in screening for depression and is considered reliable and effective24.
Liquid chromatography and mass spectrometry
We employed a liquid-liquid extraction method to extract metabolites and lipids from serum samples25,26. Subsequently, the resulting dried samples were frozen at − 80 °C until subsequent LC-MS analysis. The Ultimate 3000 UHPLC system with Q-Exactive HF MS (Thermo Fisher Scientific, Waltham, MA, USA) was used for metabolomics and lipidomics analysis. Specifically, an Xbridge amide column (100 × 2.1 mm i.d., 3.5 μm; Waters, USA) was utilized at 30 °C for the metabolomics analysis, while a reversed-phase BEH C18 column (2.1 mm×100 mm, 2.5 μm, Waters, USA) was employed at 40 °C for the lipidomic analysis. Further details are provided in the Supplementary Methods section.
Covariates
The covariates including age, sex, body mass index (BMI), smoking, passive smoking, drinking, household income, fish consumption frequency, and physical activity frequency were collected by the questionnaire. The covariate selection process is visually represented in the Directed Acyclic Graph (DAG) presented in Fig. 2. Annual household income exceeding 100,000RMB (≈ US$15,000) is defined as high household income, and the rest is defined as low household income27. Fish consumption was separated into two categories (fish consumption less than once a month versus fish consumption at least once a month)15. The following lifestyle behaviors were dichotomously defined: smoking, at least one cigarette per day for 6 months; passive smoking, breathing in other people’s smoke at least one cigarette per day for 6 months; drinking, at least once per month for the past 3 months; physical activity, physical activity at least once a week28.
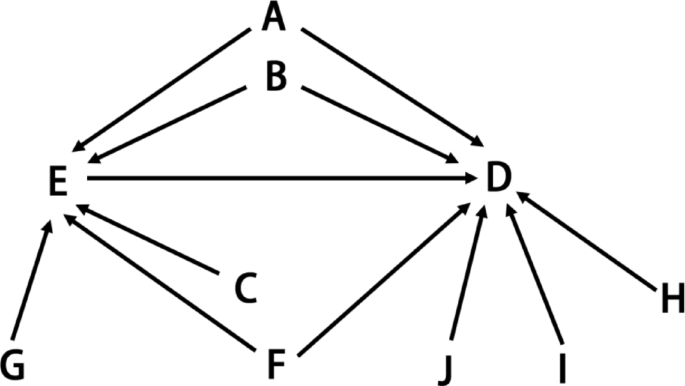
The Directed Acyclic Graph for covariates selection criteria. A: Age; B: sex; C: Fish consumption frequency; D: Outcome; E: Exposure; F: Smoking and Passive smoking; G: BMI; H: Drinking; I: Household income; J: Physical activity frequency.
Statistical analysis
Blood mercury levels were analyzed as a continuous measure and log2-transformed to meet normality. We used the linear mixed-effects model with adjustment for all covariates to examine the association between blood mercury levels and depressive symptoms scores. We conducted a follow-up study, with blood mercury concentrations and depression scores measured as repeated data. Linear mixed-effects model is ideal for data that exhibit an internal hierarchical structure, making it suited for repeated measurement data, such as the repeated PHQ9 scores in this study. Additionally, by accounting for random effects that may vary between individuals, the linear mixed-effects model can effectively incorporate both fixed and random effects within the data. We used restricted maximum likelihood estimation (REML) to estimate regression coefficients and standard deviations. The linear mixed-effects model adjusted potential confounders based on the association between depressive symptom scores and blood mercury levels, including gender, age, BMI, income, smoking status, alcohol consumption, fish consumption, physical activity, and passive smoking status. We used the same model to conduct stratification analyses by sex and fish consumption. We also conducted several sensitivity analyses. First, separate analyses were performed in non-smoking or non-drinking populations to assess the robustness of our results. Second, selenium (Se) acts antagonistically with mercury in vivo. The toxicity of mercury is reduced by complexes such as Se – Hg precipitation, or by antioxidant effects29. Therefore, we used a linear mixed-effects model, incorporating mercury and selenium, to construct a two-pollutant model to investigate the stability of the model. We also stratified participants into groups based on PHQ-9 scores and then used the ordered logistic mixed model (cumulative link model, CLMM) to analyze the association between mercury concentrations and the severity of depression.
To investigate the effect of blood mercury exposure on metabolites, we conducted a metabolomic analysis on samples stratified by quartile blood mercury levels. Firstly, single-factor analysis of variance and post-hoc Duncan analysis were utilized to compare statistical metabolic changes associated with mercury exposure, with significance determined at a corrected p-value less than 0.05. Secondly, a linear mixed – effect model was applied to evaluate the associations between identified metabolites and blood mercury level. Here, the mercury exposure level was set as the independent variable and the relative content of metabolites was set as the dependent variable. Covariates including age, BMI, gender, fish consumption, and socioeconomic status were incorporated as fixed effects in the model to control for their potential confounding effects. P-values less than 0.05 were considered significant. All analyses were conducted in R (version 4.2.1) software.
Metabolite identification
Metabolites and lipids were identified based on primary mass spectrometry (MS1) and secondary mass spectrometry (MS2) spectra using MSDIAL software. MS/MS refers to a tandem mass spectrometry technique that consists of MS1 and MS2. During MS1, sample molecules can be ionized and then separated based on the mass-to-charge ratio (m/z). Precursor ions are guided to the impact chamber and then break to form product ions. MS2 is the second stage of mass spectrometry, which is mainly responsible for further fragmentation and analysis of specific ions selected by MS1, providing detailed information about the molecular structure information30. The MassBank database was searched to identify metabolites. Also, a Lipid Blast-based silica spectral database (version: LipidDBs-VS23-FiehnO) was used to identify lipids. MS1 and MS/MS search tolerances were set to 0.01 Da and 0.05 Da, respectively, with an identification score cutoff of 70%. Other parameters used in MS-DIAL are set to default values.
Pathway analysis
Subsequently, the metabolites exhibiting statistically significant differences were cross-referenced with the HMDB and KEGG databases. The Human Metabolome Database or HMDB (http://www.hmdb.ca) is a web-enabled metabolomic database containing comprehensive information about human metabolites along with their biological roles, physiological concentrations, disease associations, chemical reactions, metabolic pathways, and reference spectra31. Kyoto Encyclopedia of Genes and Genomes or KEGG (www.genome.jp/kegg/) is a database resource for understanding high-level functions and utilities of the biological system, such as the cell, the organism, and the ecosystem, from molecular-level information, especially large-scale molecular datasets generated by genome sequencing and other high-throughput experimental technologies32,33,34. Lastly, to elucidate the major metabolic pathways involving the identified metabolites, we conducted a pathway analysis using MetaboAnalyst 5.0. We mapped all significantly altered metabolites onto relevant metabolic pathways.


Leave feedback about this