


Molecular Docking and molecular dynamics simulations
Before molecular docking, an open conformational state of the SARS-CoV-2 PLpro 3D structure (PDB ID: 6WX4), regarding the BL2 (residues Gly266–Gly271) access loop to the active site, was characterized by a short MD simulation, measuring inter-residue distances through frame-by-frame analysis. This protein open conformational state is crucial to allow the compound of interest to access the enzyme’s active site and establish effective interactions22.
Among various docking validation methods, such as redocking and consensus, cluster analysis helps group data into subsets called clusters. It analyzes docking results and identifies if poses can be grouped. GOLD clusters dock solutions based on the similarity of their poses, measured by RMSD. A link can be generated to the top-ranked solution from each distinct cluster42. Clusters must reflect the real trend of the explored conformational space and discard irrelevant differences, making it easier to identify conformations worth analyzing and cast off outliers43. The docking poses of the five PLpro-LQMed complexes were evaluated by clustering analysis, presenting fitness score values of 58.09 (426), 54.57 (428), 49.26 (430), 49.13 (431), and 45.71 (432).
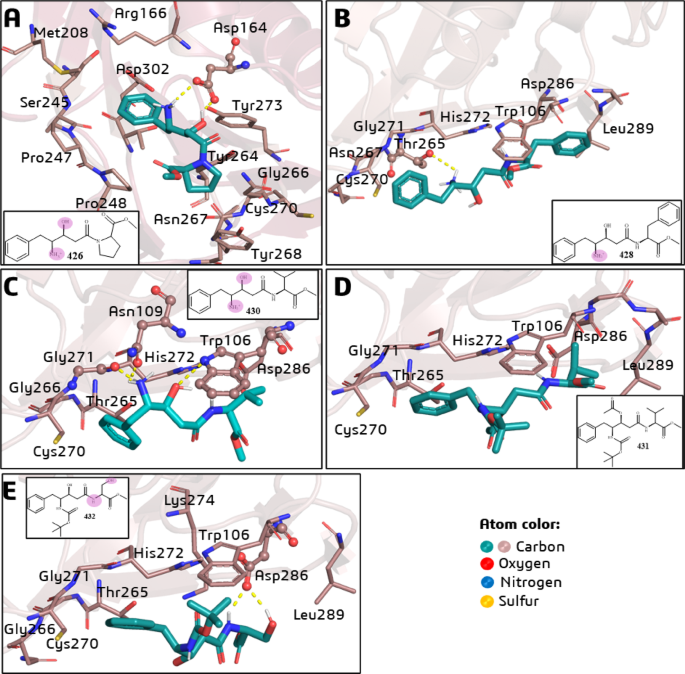
Regarding the PLpro-426 complex (Fig. 1A), it was observed that the carboxylate group of Asp164 interacts simultaneously with the β-hydroxyl (H-bond) and γ-ammonium (charge-enhanced H-bond) groups of 426. In addition, 426 makes hydrophobic interactions with Leu162, Met208, Pro247, Pro248, Tyr264, Asn267, Tyr268, Cys270, Tyr273, and Thr301, which are reported residues involved in substrate binding44 (Fig. 1A). Some of these residues (i.e., Tyr264, Asn267, Tyr268, and Cys270) are part of the access loop (BL2) to the active site, where the catalytic triad (Cys111, His272, and Asp286) is located.

Best pose by docking simulations of the statine-based peptidomimetics (LQMed compounds) on the active site of SARS-CoV-2 PLpro: (A) 426; (B) 428; (C) 430; (D) 431; and (E) 432. The residues involved in H-bond interactions (dashed yellow lines) with the ligands are represented in ball-and-stick models, and residues involved in hydrophobic interactions are in stick models. In the 2D structures, the atoms (or groups) of the ligands involved in H-bond interactions are circled in pink.
Compounds 428 (Fig. 1B), 430 (Fig. 1C), 431 (Fig. 1D), and 432 (Fig. 1E) occupy a very similar pocket in the substrate binding site. They all share common interactions with the following amino acid residues: Trp106, Thr265, Gly266 (BL2), Cys270 (BL2), Gly271 (BL2), His272 (catalytic), Asp286 (catalytic), and Leu289. However, only 431 (Fig. 1D) did not show any H-bond. Compound 428 (Fig. 1B) interacts via H-bond with Thr265, 430 (Fig. 1C) interacts with Trp106, Gly271, and catalytic His272, and 432 (Fig. 1E) interacts with catalytic Asp286.
The shorter chain of 426 (Fig. 1A) to the other compounds (Figs. 1B-E) facilitates its interaction with the PLpro substrate binding pocket. On the other hand, compounds 428, 430, 431, and 432 have longer chains and bulkier substituents, such as benzyl (428), isopropyl (430 and 431), and hydroxymethyl (432) groups. In the case of 431 (Fig. 1D), the simultaneous protection of the β-hydroxyl and γ-amino (ammonium) groups impairs the corresponding H-bond interactions. It is worth noting that the hydroxyl and ammonium groups carried out H-bond (and charge-enhanced H-bond in case of ammonium group in 426) interactions observed for other compounds, which can act as pharmacophores in this case.
We performed molecular dynamics (MD) simulations of the best docking poses of the PLpro-LQMed complexes to confirm if the binding mode observed from docking would encourage favorable and persistent interactions in an aqueous system over a 500 ns simulation period.
According to the RMSD (root-mean-square deviations) analysis of the ligand’s atoms during the MD simulations, in general, the compounds showed high RMSD (and standard deviation, SD) values, ranging from 29.5(± 11) to 71.9(± 20) Å (Fig. 2). Compounds 426 and 428 exhibited the highest RMSD (and SD) values of 52.4(± 26.6) and 71.9(± 20) Å, respectively, reflecting significant displacements during nearly all MD simulations compared to their initial docking poses (as shown in Fig. 2A-B). The other ligands also displayed high movements compared to their initial docking poses, presenting RMSD (and SD) values of 46.9(± 17) (430, Fig. 2C), 36.3(± 20) (431, Fig. 2D), and 29.5(± 11) Å (432, Fig. 2E). The longest periods of smallest displacement from the initial poses refer to the ligands 431 (Fig. 2D) (RMSD = 14.6 ± 2.3 Å, from 320 to 460 ns of the MD simulation) and 432 (Fig. 2E) (RMSD = 25.9 ± 1.2 Å, from 120 to 500 ns of the MD simulation).
The minimal variation in the RMSD values (and SD ≤ 1.0 Å) calculated from the Cα-atoms of the PLpro-LQMed complexes indicates a low displacement of the protein main-chain in the presence of compounds (Fig. 3A-E). The RMSD (and SD) values obtained were 2.29(± 0.43), 3.35(± 1), 2.35(± 0.43), 2.31(± 0.41), and 2.94(± 0.48) Å for 426, 428, 430, 431, and 432, respectively. However, there were more significant variations for 428 from 300 ns, even though the SD values differed slightly.
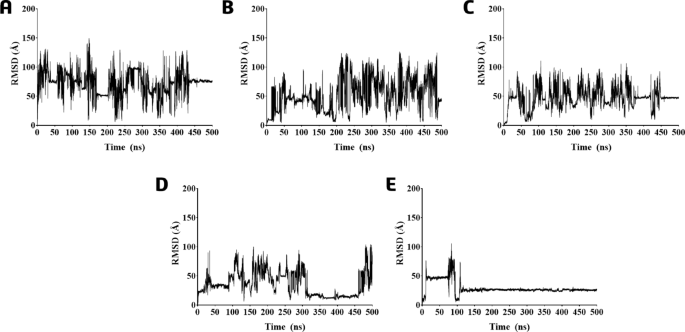
RMSD graph during 500 ns of the MD simulations of the protein-ligand complexes based on the ligand’s atoms of compounds (A) 426; (B) 428; (C) 430; (D) 431; and (E) 432.
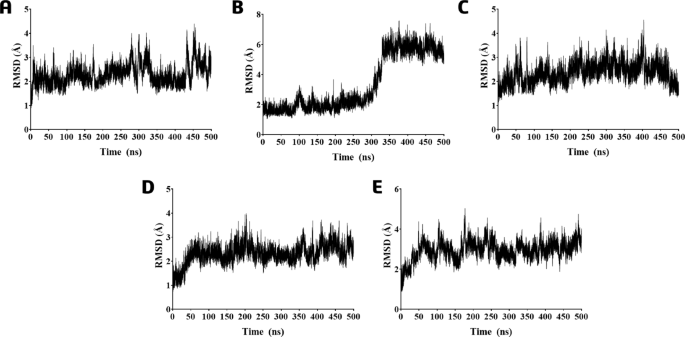
RMSD graph during 500 ns of the MD simulations of the protein-ligand complexes based on the protein Cα-atoms from PLpro in the presence of compounds (A) 426, (B) 428, (C) 430, (D) 431, and (E) 432.
We performed root mean square fluctuation (RMSF), a key metric used to quantify the flexibility of individual atoms or residues in the proteins, in which fluctuation values ≤ 2.0 Å are considered acceptable for stable complexes45. It is interesting to note that the Cα-atoms RMSF calculation indicates that the residues with a mobility more significant than 3.0 Å for all compounds (Fig. 4) were Asn186-Gln196 and Gly219-Tyr231 (two cyan arrows) from the zinc finger domain (in cyan) (Zn2+ ion coordinated by four cysteine residues: Cys189, Cys192, Cys224, and Cys226) (Fig. 4), which is vital for protease activity and its structural integrity. In addition, considerable fluctuations were also observed in residues Tyr268 and Gln269 belonging to the access loop BL2 (red) to the active site (yellow) of PLpro (Fig. 4). A significant fluctuation was observed in residues Glu1-Asp61 of the N-terminal ubiquitin-like (Ubl) domain (pink) and Asp62-Ty65 helix from the S2 ubiquitin-binding site (green) when ligand 428 was present in the system (Fig. 4). This observation is particularly interesting as RMSD analysis indicated elevated values for the Cα-atoms during the MD simulations. These fluctuations reinforce the highest displacement observed before for this ligand (Fig. 2B), highlighting the dynamic nature of the interactions between the ligand and the protein. We also performed MD simulations of the holoenzyme, and the RMSF analysis indicated a similarity to the fluctuations observed in ligands, except for 428, as noted earlier (Fig. 4).

Cα-RMSF graph relative to the MD simulations of the PLpro-LQMed complexes and holoenzyme (PLpro). Ligands 426 (red line), 428 (orange line), 430 (green line), 431 (blue line), and 432 (pink line); and holoenzyme (black line). Ribbon diagram of the PLpro enzyme: The cyan (zinc finger domain), red (BL2), yellow (active site), green (S2 helix), and pink (Ubl) arrows (and cartoons) indicate amino acid residues with the highest RMSF fluctuations.
A free energy landscape (FEL) map (Figure S1) was plotted from the MD simulation trajectories of the holoenzyme to monitor the possible opening and closing movement of the BL2 loop, as we observed significant fluctuations in the RMSF analysis. The FEL map was generated using the first two principal components (PC1 and PC2) through the InfleCS (Inflection Core State) program36. In Table S1, we can compare the distances between residues Gly266-Gly271 related to the BL2 loop of three PLpro 3D structures, namely, PDB, docking, and MD. The PDB (6WX4) structure represents the less open conformation, suggesting a more closed or restricted state of the protein, consistent with the fact that this structure corresponds to the enzyme in a covalent complex with the VIR251 inhibitor. On the other hand, the prepared molecular docking structure presented the highest degree of open conformation, likely reflecting an idealized state that maximizes accessibility to the active site. The holoenzyme structure of the MD simulations provides an intermediate degree between the open and closed conformational states, capturing the dynamic behavior of the protein and offering a more realistic representation of its conformational flexibility under physiological conditions.
To elucidate the dynamics and conformational stability of enzyme-ligand complexes throughout the MD simulations, we conducted a principal component analysis (PCA) focusing on the Cα-atoms of the protein (see Figure S2)35,46. The first two eigenvectors encompass 44–69.8% of the total motion observed within each protein-ligand complex (Figure S2). Notably, complex 428, which exhibited the most pronounced fluctuations within the Ubl domain (Glu1-Ala68) in comparison to the holoenzyme, displayed a diminished contribution to the first principal component (PC1) (30%) and second principal component (PC2) (25.7%). In a similar vein, complex 432 manifested slightly lower contributions from PC1 (28.7%) and PC2 (15.3%), which may be indicative of the ligand exit from the active site; hence, its influence on PC1 is comparatively less pronounced. Furthermore, complexes 426, 430, and 431 showed similar contributions to PC1, ranging from 33 to 35.8%, and PC2 from 28.9 to 34% (Figure S2).
The FEL maps (Figures S3 and S4) were also generated to ligands using the first two principal components (PC1 and PC2) through the InfleCS. This approach identified representative conformations from the MD simulation trajectories, facilitating the location of energy minima (blue, representing more stable states) and maxima (red, indicating fewer stable states) within the conformational space.
In our analysis of compound 426, we identified populated clusters represented within distinct Gibbs free energy minima (Figure S3). The most populated cluster (yellow) corresponds to a low-energy state, suggesting highly stable conformations in an allosteric site formed by the residues Asn13, Asn15, Leu16, Asp37, Met84, Leu87, and Asn146. Conversely, the second cluster (orange) represents an intermediary state, highlighting a lower stability of this complex (Figure S3A). Ligand 428 points stable conformation for its third most populated cluster in a low-energy state (yellow). This conformation is situated near the active site and the BL2 region, comprising the residues Arg166 and Met208 (Figure S3B).
To ligand 430, we found two main populated clusters. The first cluster corresponds to the compound dissociated from the enzyme (i.e., 430 unbound, orange) (Figure S4A). The second cluster corresponds to a low-energy state, suggesting highly stable conformations in the allosteric site observed to 426 (yellow), with ligand pocket comprising the residues Thr9, Gln19, Phe31, Val57, Leu58, Pro59, Asn60, Asp61, and Leu64 (Figure S4A). The most populated cluster (yellow) to ligand 431 in the access of the active site comprising the residues Tyr264, Pro248, and Asn267 from the BL2 loop, interacted with the phenyl ring of the ligand (Figure S4B). The phenyl ring, acting as a substituent, was also responsible for the ligand’s interaction within a pocket formed by the active site residues Cys284, Leu289, Leu290, Thr291, and catalytic Asp286. Its conformation corresponds to a second cluster of low-energy states (orange, Figure S4B). To ligand 432, contrary to the others, we found the most populated cluster in the low-energy states with a conformation in a pocket between the thumb, fingers (zinc finger), and palm domains. This is one (S1) of two sites that includes the residues Arg166 Glu167, Ser170, Tyr171, Met206, and Met208 (yellow, Figure S4C) where PLpro binds ubiquitin and ubiquitin-like substrate proteins47.
The behavior of the different statine-based compounds became more evident after analyzing the H-bonds formed during the simulation period. The 426 performed H-bond (6.3–8.2%) with Asp62 (Fig. 5A and S5A), while ligand 428 interacted with residue Asp164 close to the active site, with a persistence of 1.6 to 2.3% lifetime (Fig. 5B and S5B). As pointed out by RMSD analysis, the two ligands disconnected from the enzyme during MD simulation, reflecting their short lifetime to the H-bonds observed.

H-bond interactions by molecular dynamics simulations of the PLpro-LQMed complexes. Ligands: (A) 426; (B) 428; (C) 430; (D) 431; (E) 432. Donor and acceptor groups involved in the H-bonds and their lifetime (%). The 3D structure represents the ligands (blue balls and sticks) involved in H-bond interactions (dashed yellow lines) with residues (orange sticks).
In the RMSD analysis of 430, it tended to move away from the active site. The H-bonds observed for this ligand indicated interaction in different regions than those predicted by the docking result, performing H-bond with residue Asp61 with approximately 5% lifetime in the same allosteric site (Figs. 5 C and S5C) of PLpro as observed to 426. Compound 431 exhibited a brief H-bond in the BL2 loop around 350–400 ns into the simulation. This point represented a period of relatively low movement during the MD simulation according to the RMSD analysis. The interaction involved residues Tyr264 (4.25%), Asn267 (2.02%), and Tyr268 (1.88%) (Fig. 5D and S5D). In contrast to the other compounds, 432 displayed an H-bond interaction in a PLpro region that was quite different and far away from the active site or the putative allosteric site identified for 426, 428, 430, and 431. The 432 showed H-bond interactions more persistent than the others in the S1 site with residues Arg166 and Ser170 with a lifetime of 10.9% and 25.1% (Fig. 5E and S5E).
We have calculated the binding free energy (ΔGbind) for the MD simulations of the protein-ligand complexes. Our analysis shows that compounds 426, 428, and 432 have similar solvation energy values ranging from + 12 to + 19 kcal/mol (Table 1). Compounds 426, 428, and 430 contain a positively charged ammonium group and have higher electrostatic energy values than those 431 and 432. However, there is a noticeable difference between 430 (−30 kcal/mol), 426 (−23 kcal/mol), and 428 (−18 kcal/mol) mainly due to the latter two having larger substituent groups, such as the pyrrolidine ring (426) and the benzyl group (428). The solvent-accessible surface area energy values were similar and ranged from − 1.2 to −2.9 kcal/mol (Table 1). The formation of PLpro complexes with ligands 426, 428, 430, and 431 in the allosteric site, along with ligand 432 in the S1 site, resulted in similar total ΔGbind energies, with slight variations ranging from − 15 to −20 kcal/mol (Table 1).
We carried out additional MD simulations for all protein-ligand complexes for 200 ns starting from the frames with the compounds located in this allosteric site to assess the compounds’ persistence thoroughly. This will help us gain deeper insights into their binding characteristics and stability. We focus on the MD analysis, but the molecular docking in this allosteric site can be accessed in the support information (Figure S6).
About PCA analysis, the first two eigenvectors encompass 35.4–63.7% of the total motion observed within each protein-ligand complex (Figure S7). Complex 432, which exhibited the most pronounced variations in RMSD values from MD compared with molecular docking, displayed a diminished contribution to the first two principal components, PC1 (24.9%) and PC2 (10.5%). Similarly, complex 428 manifested slightly lower contributions from PC1 (28.9%) and PC2 (25.4%), which may indicate the short H-bond persistence in the allosteric site; hence, its influence on PC1 is comparatively less pronounced. Furthermore, complexes 426, 430, and 431 showed similar contributions to PC1, ranging from 36.8 to 40.8%, and PC2 from 12.8 to 26.1% (Figure S7). In conclusion, complex 432 demonstrates the highest conformational stability, as evidenced by its lowest PC1 and PC2 values, which signify more restricted and less dispersed conformational motions during the MD simulations. Conversely, 430 appears to possess the least stability, as indicated by its highest PC1 value, implying broader conformational motions and, consequently, reduced stability. Complex 426 occupies a position of intermediate stability, contributing significantly to both PCs, albeit not as distinctly as 430. Complex 428 displays intermediate conformational stability; it is more stable than complexes 430 and 426 while less stable than 432.
Our analysis of the FEL maps of 426 identified that the most populated cluster corresponds to a low-energy state, suggesting highly stable conformations in the extreme surface of the allosteric site formed by the residues Glu1, Val2, Arg3, Thr4, Lys6, Val7, and Met23 (Figure S8A). Complex 428 points stable conformation for its most populated cluster in a low-energy state, with its conformation situated near the S2 alpha-helix comprising the residues Thr63, Leu64, Arg65, Val66, Ala68, Phe69 and Glu70 (Figure S8B). To complexes 430, 431, and 432, we found the most populated clusters in the same region of the allosteric site comprising the amino acid residues Thr9, Gln19, Gln30, Asp61, and Thr63. Complex 430 presents other clusters of intermediate energy levels; however, these do not demonstrate stability in forming the bond between the ligand and the enzyme (Figure S9A). 431 exhibits the least favorable FEL map, primarily characterized by a single, highly populated cluster in a low-energy state (Figure S9B). Conversely, 432 displays a more favorable FEL map, revealing multiple minimum energy clusters that suggest a higher probability of enzyme-ligand complex formation (Figure S9C).
We previously discussed that the MD involving the ligands in the active site tends to shift towards the allosteric site (i.e., Ubl domain region) (Fig. 2). However, in our MD simulations in the allosteric site (Fig. 6), we observed that, despite generally high RMSD (and SD) values, the ligands consistently remained within the Ubl domain region, which is the allosteric site under investigation. Additionally, specific ligands exhibited periods of relatively low displacement in forming their complexes in the allosteric site, a phenomenon that had not been observed before for the ligands in the active site.

RMSD graph during 200 ns of the MD simulations of the protein-ligand complexes (starting from the frames with the compounds located in the allosteric site) based on ligands atoms of compounds: (A) 426; (B) 428; (C) 430; (D) 431; and (E) 432. The representative poses of each ligand during MD (yellow) and molecular docking (cyan) simulations are shown for the best comparison.
In summary, the RMSD analysis demonstrates that the ligands 426 (Fig. 6A) and 431 (Fig. 6D) displayed reduced variation in their poses during molecular dynamics (MD) compared to molecular docking. Both ligands remained within the same binding pocket, albeit with alterations to their conformations. Ligand 428 (Fig. 6B) shifted to the interface region of the PLpro’s S2 site within the helix, while ligand 430 (Fig. 6C) remained in the Ubl domain, but on the surface near the S2 site. Although ligand 432 (Fig. 6E) did not significantly move from its binding site, it exhibited the highest RMSD value due to the inversion of its conformation, especially the binding mode where the substituent phenyl ring alters its position docking. During the beginning of the MD simulation (0–50 ns), ligand 426 had an RMSD of 16.6(± 26) Å (Fig. 6A), whereas ligand 428 recorded an RMSD of 37.4(± 3.37) Å in the last segment of the MD simulation from 125 to 200 ns (Fig. 6B). Ligands featuring isopropyl (430 and 431) and hydroxymethyl (432) groups demonstrated the lowest displacement in complex formation, exhibiting lower RMSD (and SD) values. It was observed that ligand 430 exhibited RMSD = 23.0(± 6.2) Å, remaining briefly in the same position for 10 ns to 75 ns (Fig. 6C). On the other hand, ligand 431 showed the lowest RMSD values of 7.55(± 1.88) Å and remained in the allosteric site for almost the entire MDs period of 0-175 ns (Fig. 6D). The 432 demonstrated greater persistence on the allosteric site; however, due to its conformation inversion, it exhibited a high RMSD of 79.9(± 1.7) Å compared to the docking pose (Fig. 6E).
To PLpro Cα-atoms, the RMSD did not show high variations (or SD), demonstrating values of 1.93(± 0.3), 2.07(± 0.36), 2.07(± 0.38), 2.17(± 0.36), and 2.40(± 0.51) Å to 426, 428, 430, 431, and 432, respectively (Fig. 7A-E). In contrast to the observations made for 428 in the MD simulation within the active site (Fig. 3B), 428 exhibited no variations in the RMSD of the protein’s Cα-atoms when analyzed in the allosteric site (Fig. 7B), indicating that it remained stable. It is interesting to note that the RMSF calculation for all compounds in the allosteric site indicated similar residue mobility more significant than 2.5 Å (Fig. 7F) for the same Cα-atoms discussed above (see Fig. 4) for the active site amino acid residues: Tyr191, Thr225, and Gly227 which was very close to the Zn2+ ion, and Tyr268 and Gln269 belong to the access loop (BL2) to the active site of PLpro. In addition, there was no fluctuation of Ubl residues caused by ligand 428 presence, as observed earlier (Fig. 7F).

RMSD graph during 200 ns of the MD simulations of the protein-ligand complexes (starting from the frames with the compounds located in the allosteric site) based on protein Cα-atoms in the presence of compounds: (A) 426; (B) 428; (C) 430; (D) 431; and (E) 432. (F) Cα-RMSF analysis was relative to the MDs of the PLpro-LQMed complexes.
Our analysis revealed that 426 and 428 established short H-bonds; their respective lifetimes were with residue Glu51 (8.7%) and Lys6 (15.8%) (Figs. 8A and S10A), Asp134 (6%) (Figs. 8B and S10B). 430 remained next to the allosteric site on the surface of the S2 PLpro substrate site but only established a bond with Asp61 and had a short lifetime of approximately 6% during the initial period until 75 ns of the MD simulations (Figs. 8C and S10C). This contrasted with the docking pose results (Figure S6C). On the other hand, the MD simulation of ligand 431 starting on the allosteric site showed a similar binding mode to the docking pose result (Figure S10D), with hydrogen bonds formed with amino acid residues Gln19 (5 to 26.4%) and Gln30 (6 to 26.6%) and remained persistent throughout all the MD simulations (Figs. 8D and S10D). Ligand 432 exhibited the same hydrogen bonding interactions with Gln19 (10.1%) and Gln30 (11.1%), which were noted for 431. Furthermore, hydrogen bonds were formed with two threonine residues, Thr9 (9.68%) and Thr63 (10.4%), along with interaction with Asp61 (16–18%) (Figs. 8E and S10E). It was anticipated that this ligand would demonstrate a more effective binding mode within this pocket, owing to the increased polarity of the residues comprising it, such as threonine, aspartate, and glutamine, which can function as hydrogen bond donors or acceptors with the hydroxymethyl substituent groups.

H-bond interactions from 200 ns of the MD simulations of the PLpro-LQMed complexes (starting from the frames with the compounds located in the allosteric site) for compounds: (A) 426, (B) 428, (C) 430, (D) 431, and (E) 432. The ligands (blue balls and sticks) that performed H-bond interactions (dashed yellow lines) with residues (orange sticks).
Binding energy analyses confirm that ligands 426 and 428 show minor affinity to the allosteric site of PLpro enzyme compared to the others, as indicated by their van der Waals, electrostatics, solvation, solvent-accessible surface area, and especially, ΔGbind energy values of −6.79 to −8.98 kcal/mol, respectively (Table 2). As previously observed, 430 had the best binding energy compared to ligands 431 and 432. Being a positively charged ligand, the electrostatic energy value of −66.1 kcal/mol contributed to its better result of ΔGbind = −27 kcal/mol (Table 2). Even though this ligand did not present persistence in the evaluated allosteric site and had a short hydrogen bond lifetime, its observed ΔGbind value was slightly higher than that assessed in MD on the active site (−19 kcal/mol, Table 1). The ligand 431 presented equal binding energy values of ~ −14 kcal/mol in both (active and allosteric sites) MD simulations. Similarly, 432 presented ΔGbind = −13 kcal/mol, which confirmed their affinity through the Ubl domain. Except for electrostatic energy, which for 431, a neutral ligand, was minimal (−2.4 kcal/mol), and electrostatic energy (−66 kcal/mol) of 430, a charged ligand, all other energy parameters were similar for both complexes of PLpro and 430, 431, and 432 (Table 2).
Ferreira et al.. identified three allosteric sites on the PLpro enzyme, with one significant site between the ubiquitin-like and thumb domains48. This site includes the critical residues Asp12, Asn13, Ile14, Leu36, Asp37, Gly38, Arg53, Thr54, Phe55, Tyr56, Tyr71, Tyr72, Tyr83, Leu87, Arg91, Ala131, Asp134, Ala135, Arg138, Glu143, Ala144, Ala145, Asn146, and Leu150. Their research demonstrates that the residues within this pocket possess the highest druggability score and facilitate vital intra- and inter-domain interactions. Furthermore, our ligands, especially 430, 431, and 432, bind to the PLpro enzyme in this Ubl domain and could be prejudicial to substrate binding. It is noteworthy that the phenolic compounds 4-(2-hydroxyethyl)phenol and methyl 3,4-dihydroxybenzoate, as reported in the literature49have been shown to inhibit substrate binding to the binding pocket of the S2 site helix of PLpro, which exhibited a calculated binding energy of approximately − 7.0 kcal/mol49. This observation is similar to that made for ligand 428, showing a value comparable to what we obtained in our research study and a binding mode in the same region, suggesting a potential for non-competitive inhibition.
Inhibition of SARS-CoV-2 PLpro
The ability of compounds to inhibit SARS-CoV-2 PLpro activity was assessed through an in vitro FRET-based assay. Table 3 summarizes the IC50 (µM) values and % of maximum inhibition compared to the negative control (vehicle, DMSO). All compounds inhibited SARS-CoV-2 PLpro activity by at least 50% (Table 3), with an IC50 ranging from 0.85 µM (compound 426) to 4.06 µM (compound 431). GRL-0617 (PubChem CID 434122139), a previously identified competitive non-covalent inhibitor of SARS-CoVs PLpro50was used as positive control and exhibited an IC50 of 0.5395 nM (Table 3).
In investigating compounds targeting SARS-CoV-2 PLpro, compounds 426 and 432 exhibited noteworthy inhibition potential, displayed the most promising IC50 values, measuring at 0.85 µM (426) and 1.46 µM (432) (Table 3), practically equipotent to the positive control (GRL-0617). Despite 426 demonstrating short lifetimes in H-bond formation and low binding free energy in our in silico studies, this ligand may indirectly influence PLpro inhibition by hindering the binding of natural substrates due to its interaction with the Ubl domain, thereby affecting its inhibitory potential. Ligand 432 exhibited the most H-bond interactions within the allosteric site and recorded the highest persistence while showcasing the second-highest inhibition value. Ligand 431, which displayed interactions and energy values comparable to 432 but with brief H-bonds persistence, also exhibited considerable inhibition potential. Our findings (%I = 51.9 and IC50 = 4.06 µM) regarding inhibition closely align with the 3,4-dihydroxybenzoate, a natural compound, reported by Srinivasan et al., where %I is approximately 70% and IC50 is 3.99 µM49. This finding could suggest a potential non-competitive (or a mixed) inhibitory action, thus aligning with the outcomes of the molecular modeling studies.
In addition, among classes of non-covalent inhibitors already reported in the literature, these statine-based peptidomimetics presented great IC50 value when compared to GRL-0617 and its analogs against SARS-CoV-1 PLpro, such as (R)−2-methyl-N-(1-(naphthalen-1-yl)ethyl)benzamide (IC50 = 2.3 ± 0.1 µM) and (R)−5-acetamido-2-methyl-N-(1-(naphthalen-1-yl)ethyl)benzamide (IC50 = 2.6 ± 0.1 µM)13. Also, repurposed inhibitors against SARS-CoV-2 PLpro such as pyronaridine tetraphosphate (IC50 = 1.8 µM)51raloxifene (IC50 = 3.28 ± 0.29 µM), and cetylpyridinum chloride (IC50 = 2.72 ± 0.09 µM)52.
In conclusion, although the present compounds exhibit lower potency, they may yield a novel chemical scaffold that can be subject to further optimization. The new compounds may serve as an initial reference for a distinct scaffold offering benefits, such as enhanced selectivity attributable to their binding profiles, which could mitigate potential side effects and may involve alternative binding sites or mechanisms. Furthermore, they may avoid resistance issues associated with the reference inhibitor or provide improved synthetic accessibility.
Drug-likeness and ADMET in Silico predictions
In silico predictions of drug-likeness (oral bioavailability) and ADMET (absorption, distribution, metabolism, excretion, and toxicity) profile were performed for compounds 426–432 and the reference inhibitor GRL-0617 (Table 4). According to the predicted drug-likeness properties, we have found that all compounds do not violate any of the Lipinski38 and Veber39 rules (MW ≤ 500; LogP ≤ 5; HBA ≤ 10; HBD ≤ 5; TPSA ≤ 140). Furthermore, the results indicate that they can achieve high absorption from the gastrointestinal (GI) tract (Table 4), thereby crossing cell barriers and entering the bloodstream to reach their biological target. Nevertheless, it is essential to note that these compounds are unable to cross the blood-brain barrier (BBB), which may lead to toxic side effects (Table 4). Compounds 426 and 430 were identified as non-substrates of P-glycoprotein (P-gp), an efflux pump protein that influences drug pharmacokinetics by removing substances from cells53. In contrast, compounds 428 and 430, along with GRL-0617, are substrates, while 431 and 432 are predicted to be inhibitors (Table 4).
According to our in silico predictions, 426, 428, and 430 may have the ability to inhibit CYP2D6. Compared to GRL-0617, they have the best potential for bioavailability, as this compound may act as an inhibitor of multiple CYP, such as CYP1A2, CYP2C19, and CYP3A4 (inhibitor/substrate), which are responsible for metabolizing carcinogenic substances54. In fact, according to experimental metabolic studies, GRL-0617 is an in vitro inhibitor of CYP enzymes, such as CYP2C9 and CYP3A455. In addition, except for compounds 431 and 432, which showed intermediate and GRL-0617 with high potential, the other compounds exhibited a short half-life (Table 4). Regarding toxicity predictions, only GRL-0617 provided evidence of mutagenic and tumorigenic properties and an irritant effect at 430. They also showed no risk of hepatotoxicity. Furthermore, there was no suggestion of activity as hERG blockers, which could cause arrhythmias56 (Table 4).
Leave feedback about this